How do I manage to do UX research within my tight schedule and with limited resources? How do I gain important insights and how do I present them to my stakeholders in a clear and meaningful way?
Nutan Sawant (UX Designer at Ingenico) and Kenneth Ma (Sales Manager at Testbirds) addressed these questions at this year’s UXinsight Festival.
Let’s take a look at the most important insights and learnings of the session.
Common Problems of Small Design Teams
Even large companies often have small design teams with only three or four employees. These small teams manage various projects running in parallel and have to meet deadlines while also handling design requests that come in from throughout the company. UX research often falls by the wayside – because nobody explicitly asks for it. Even if the topic isn’t commonplace within the company, UX research is an important part of product development – if not THE most important part. Without user feedback on a product, you’re fumbling in the dark and developing products based on assumptions instead of facts.
Even if a company decides that the design team should conduct UX research, new challenges arise in daily work. A large amount of research data needs to be evaluated, which requires a considerable amount of time. Using the right approach for data analysis and preparation is also a decisive factor. It’s not enough to simply repeat what users or testers say about the product, you also need to structure and classify it. On top of this, if it’s not clear from the outset what the aim of the research or test is, the results might not be entirely relevant or completely useless in the worst case.
So, how do you get relevant results? And how do you share them later with your stakeholders and colleagues? Nutan presented one possible scenario in the joint session with Kenneth.
The right research method
When it comes to finding a suitable research method for your UX test, the first question you should ask yourself is “What’s the goal of my project?”, because your objective has a major influence on the choice of method.
You should also be very realistic about the possibilities – both in terms of time and in terms of resources and skills that you have available for your analysis. After all, even the best data is useless if there’s no time or know-how to evaluate it properly.
As a third point, you should consider that the personal preferences of the researcher play a role in the selection of a research method. Here too, you shouldn’t make life unnecessarily difficult for yourself or your employees but choose a research method that fits to your capabilities.
In Nutan’s case, the choice fell on unmoderated remote testing. The reasons for this were the required worldwide execution of the tests, the limited time available, and the convenience for both sides – for Nutan herself and for the testers involved. Another advantage of remote testing is that the users remain in their familiar environment and use their own devices. This provides an unfiltered view in real-world conditions.
From her point of view, this method is particularly recommended for the beginning of research and in combination with other methods. So, written feedback can be a first step before inviting individual testers to interviews to ask detailed questions.
Structure research data smartly
Especially at the moment, it’s extremely important to remember that most teams communicate and work online from many different locations. You should also take this fact into account when structuring your research data. After all, it’s hardly possible to organize data together on a whiteboard or flipchart in the current situation.
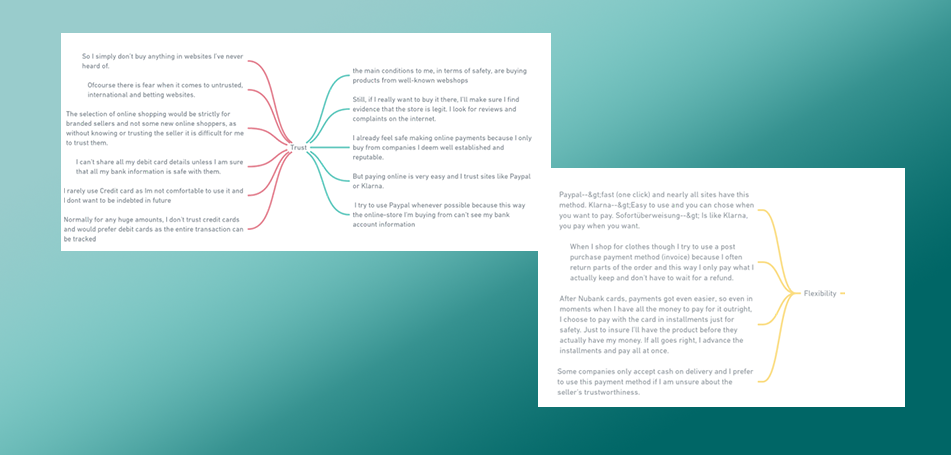
Nutan, therefore, decided to make the affinity mapping required for their study visible to all team members using mind map tools and to also give them the opportunity to collaborate on the affinity map.
In affinity mapping, data is viewed separately from each other and assigned to thematically appropriate groups.
Present results impressively
After you have collected and analyzed the results using the right method, what I deem to be the most important part of your work starts – presenting the results in a way that convinces the decision-makers.
An endless desert of text is most likely not the most suitable way to present results. Let’s face it, nobody has the time or motivation to read a dry, multi-page essay about your research. Therefore, it’s important to prepare the results in a simple and understandable way, without losing validity. “Snackable Insights” is the magic term here.
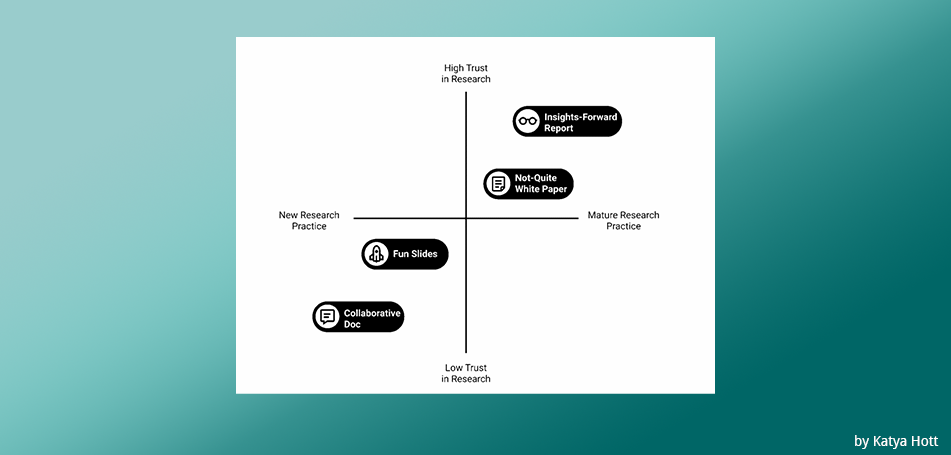
The following chart shows that the report is also based on how much trust your company already has in UX research.
If your research is the first UX test ever performed in your company, it may make sense to go into more detail about the structure of the test and how it’s performed. However, if you regularly perform such tests, this part will be of little interest and can be put on the back burner.
In this case, a so-called “insights-forward report” is suitable, in which the section on research methodology is kept relatively short and the user quotes shown are precisely selected.
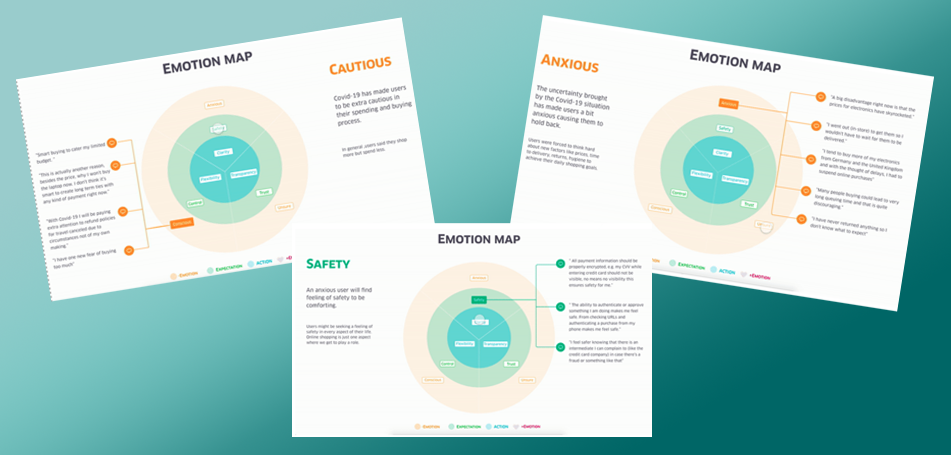
Don’t be afraid to choose a creative way to prepare the data and the results in a meaningful and impressive way – for example in the form of a video.
Key Take-Aways and Tips
Let me summarize the key take-aways you should always keep in mind for your UX research:
- The choice of research method depends not only on your objective, but above all on your internal capabilities in terms of conducting the test and analysis.
- Think about written feedback instead of remote interviews – it can save you a lot of time.
- When structuring research data, looking at the data independently of the actual research objective can help you discover unexpected correlations.
- When structuring the data, reduce the results to the essentials and show the connection between the original data and the results – ideally interactively.
- When preparing the data for your stakeholders, it’s worth using creative ways in order to present the message behind your research in the best possible way.
Share it if you like it:
Tag Cloud
About the author
When Simone is not working on superb texts for Testbirds, she and her horse live it up on the tournament areas in Bavaria.
Categories
Links
Rate this post
Other content that might be interesting for you:
Testbirds specialises in the testing of software such as apps, websites and Internet of Things applications by using innovative technologies and solutions. Under the slogan, “Testing Reality”, the company offers various testing methods to its clients looking to optimise the user-friendliness and functionality of their digital products. With over 250,000 registered testers located in 193 countries, Testbirds is one of the world’s leading crowdtesting providers. In addition, the IT service provider utilises cloud based technologies to support customers in the optimisation of their digital products. The combination of the two testing methods delivers a unique and extensive portfolio that takes the quality of software to the next level. Testbirds was founded in 2011 by Philipp Benkler, Georg Hansbauer and Markus Steinhauser. Today, the company has over 100 employees. Other than its headquarters in Munich, there are now offices in Amsterdam, London and Stockholm, franchises in Hungary and Russia and sales partners in Italy.
© Testbirds GmbH. All rights reserved.


