Mobile devices and Mobile Apps
The evolution of the mobile industry does not go unnoticed. We have come a long way from playing Snake on our Nokia 3310. Mobile devices have become an indispensable part of our daily lives, incorporating both our personal and professional lives. We cannot leave our home without them; we use them everywhere and increasingly rely on them for various activities. At the heart of mobile devices are mobile apps – they simply make our lives ‘oh so’ easier. Remember the time you actually had to rely on maps instead of simply typing in the address on your Google Maps app and voilà!
Apps are especially important for enterprises
As important mobile apps are to their users, they are even more so for enterprises. Among other things, they have transformed consumer behavior and changed the way consumers shop, making it crucial for enterprises to tap into this market. However, the mobile app industry is constantly in flux, making it difficult to keep up. To truly comprehend the current state of the mobile app industry, and especially its exponential growth, Testbirds has gathered facts and figures as well as explored recent breakthroughs in the industry.
Smartphone Saturation on the Rise
Smartphone usage is continuously on the rise. As of January 2014, 90% of all American adults have a cell phone, with 58% having a smartphone. Slightly more men (61%) have a smartphone than women (57%) and the younger age groups are more likely to own a smartphone. The same research by Pew Research Internet Project showed that 42% of Americans own a tablet.
1 Billion Smartphones Shipped Globally in 2013
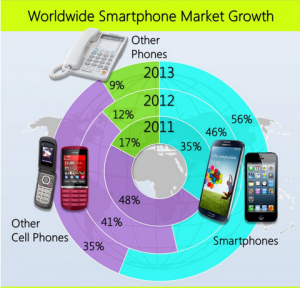
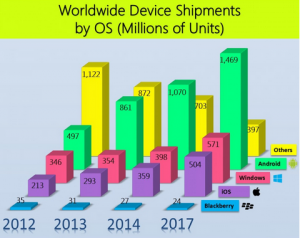
A new report from the research firm IDC shows that mobile manufacturers shipped one billion smartphone devices worldwide in 2013. That is an increase of 38.4% from 2012 and more than double the amount of devices sold in 2011. Interestingly, the market growth is largely driven by demand for cheap devices, especially in China and India. Samsung is keeping its market leading position between the years with a 31.3% market share, leading Apple’s segment of 15.3%.
From 3G to 4G
The data speed improvement from 3G to 4G has contributed somewhat to the exponential growth of mobile app usage. This lightning-fast wireless data network is comparable to home broadband services in speed, and is roughly 10 times faster than 3G. This allows us to do activities on our mobile devices that few years ago were unheard of. For example, a high-definition movie can now be downloaded in about three minutes.
Americans Access the Internet Primarily through Mobile devices
Last January in the U.S. was the first time that mobile applications exceeded PCs in terms of Internet usage. The total Internet usage through mobile devices was 55%, with mobile applications accounting for 47% thereof. Meanwhile, the Internet usage through PCs was 45%.
Number of apps
148apps.biz has provided App Store metrics since 2008 when the US App Store reached the milestone of 10,000 apps. At that time, this number was considered remarkable but today, the number of apps has reached over 1 million.In February this year, there were 25,053 apps and 6,329 games submitted to the App Store with an average of 1,012 per day. This adds to a total of 1,134,183 active applications in the App Store (consisting on 934,515 apps and 199,668 games). Moreover, there are 285,958 active app publishers in the App Store.Android’s Google Play hosts 1,173,187 apps as of 16th of March 2014. In February, there were 39,938 new apps released on Google Play, which are 8,556 more apps than were submitted to the App Store.
Prices for apps
The price categories for apps in the App Store range from zero to $999.99 with the average app price being $1.31 ($1.44 for apps and $0.74 for games – including all the free apps). A total of 734,834 or 64.14% of all apps can be downloaded for free. However, many apps are based on a Freemium model, meaning that the initial download is free but additional features come at a price.There is a price cap of $200 on Google Play, making the difference between the highest price categories on Google Play and App Store $800. The distribution of free vs. paid Android apps is highly skewed, with 82% of all Android apps being free of charge.
App Categories
Out of the 24 app categories in the App Store, games make up the largest category (17.55% of all apps), followed by education (10.24%), lifestyle (7.84%), business (7.70%) and entertainment (7.66%). Weather apps sit at the bottom with 0.38% of all apps.The top five app categories on Google Play are entertainment (104,833 apps), personalization (90,017 apps), lifestyle (87,410 apps), education (80,913 apps), and books & reference (78,147). The category with the fewest number of apps is music & audio (52,347 apps).
The Top 10 Countries with the Highest Average Number of Installed Apps per Smartphone User
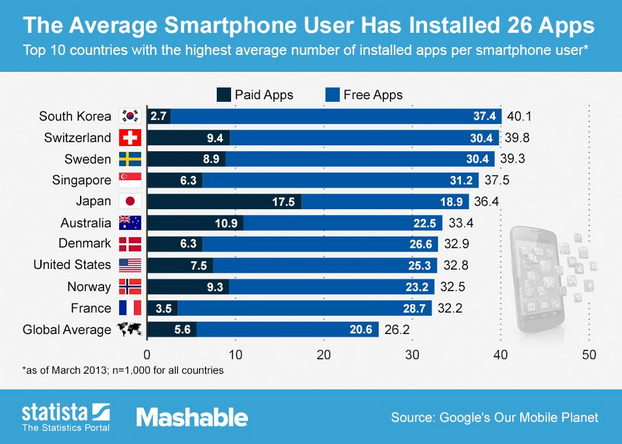
In 2013, Statista created a chart based on data from Google’s Our Mobile Planet. The chart showed the top 10 countries with the highest average number of installed apps per smartphone user. While the global average is 26 apps per smartphone user, the average South Korean smartphone user installs 40.1 apps. The average Swiss smartphone user comes in second with 39.8 installed apps, followed by the average Swedish smartphone user who installs around 39.3 mobile apps.Interestingly, Japanese smartphone users install considerably more paid apps than other countries on the list or 17.5 apps (out of 36.4 apps). This is also true for Australia (10.9) and Switzerland (9.4). In comparison, South Korean smartphone users only pay for 2.7 apps of their record number of 40 installed apps.
iOS vs. Android – Apps vs. Oranges
While App Store has only 18.2% market share, Google Play has 74.4% market share. However, while App Store’s daily revenue reaches $5.1 million, Google Play’s daily revenue only reaches $1.1 million.Google Play has a larger installed base and a greater variety of Android devices. In September 2013, more than 1 billion Android devices had been activated. At the same time, Apple had sold over 700 million iOS devices.
Record-breaking Sales for Mobile Apps in the App Store
Beginning of this year, Apple announced a record-breaking December with over $1 Billion in mobile app sales. App Store customers downloaded almost three billion apps, making December 2013 the most successful month in App Store history. The success was partially contributed to the introduction of iOS 7 in September 2013.
The fragmentation of the mobile market
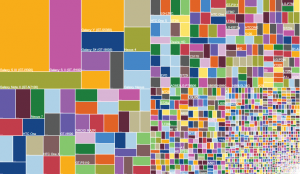
iOS 7 is installed on 78% of all Apple devices while Android has a far more fragmented ecosystem. Jelly Bean 4.1.x, 4.2.x and 4.3 accounts for 62% collectively, while not being the latest version. KitKat (version 4.4) is only installed on 2.5% of Android devices
What are the implications for app developers?
With an exponential growth in smartphone dispersion and app releases, the future of the app industry seems bright. At the same time, the fragmentation on the mobile market makes it hard for app developers to ensure a consistent experience across all devices and operating systems. How can an app developer have access to the different types of mobile devices and operating systems? Testbirds has the answer.

